


Mexican vs Chinese Factories
With the rising cost of wages in China, manufacturers are increasingly considering Mexico an attractive location to ‘re-shore’ production.
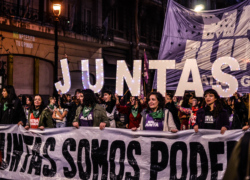
Between 2017 to 2022, remittances sent to Mexico from the US have experienced double-digit growth, and just during pandemic times, 2020-2022 they almost doubled in absolute numbers to 41 percent (See Figure 1).
The following note reviews some of the factors driving recent growth. Typically, increases in remittances are due to increases in the principal sent (through frequency and amount remitted), or by increases in the number of senders (typically through migration).
As the note shows, we point to increases in transfer frequency and number of senders, increases in the annual principal amount, and an increase in migration to the US that, combined, explain the recent uptick in remittances. This review points out basic facts and the numbers themselves counter unsupported assumptions about an exaggerated growth. Based on current data, and changing patterns in both migration and sending, we estimate a 9 percent increase in 2023.
Migration Patterns from Mexico
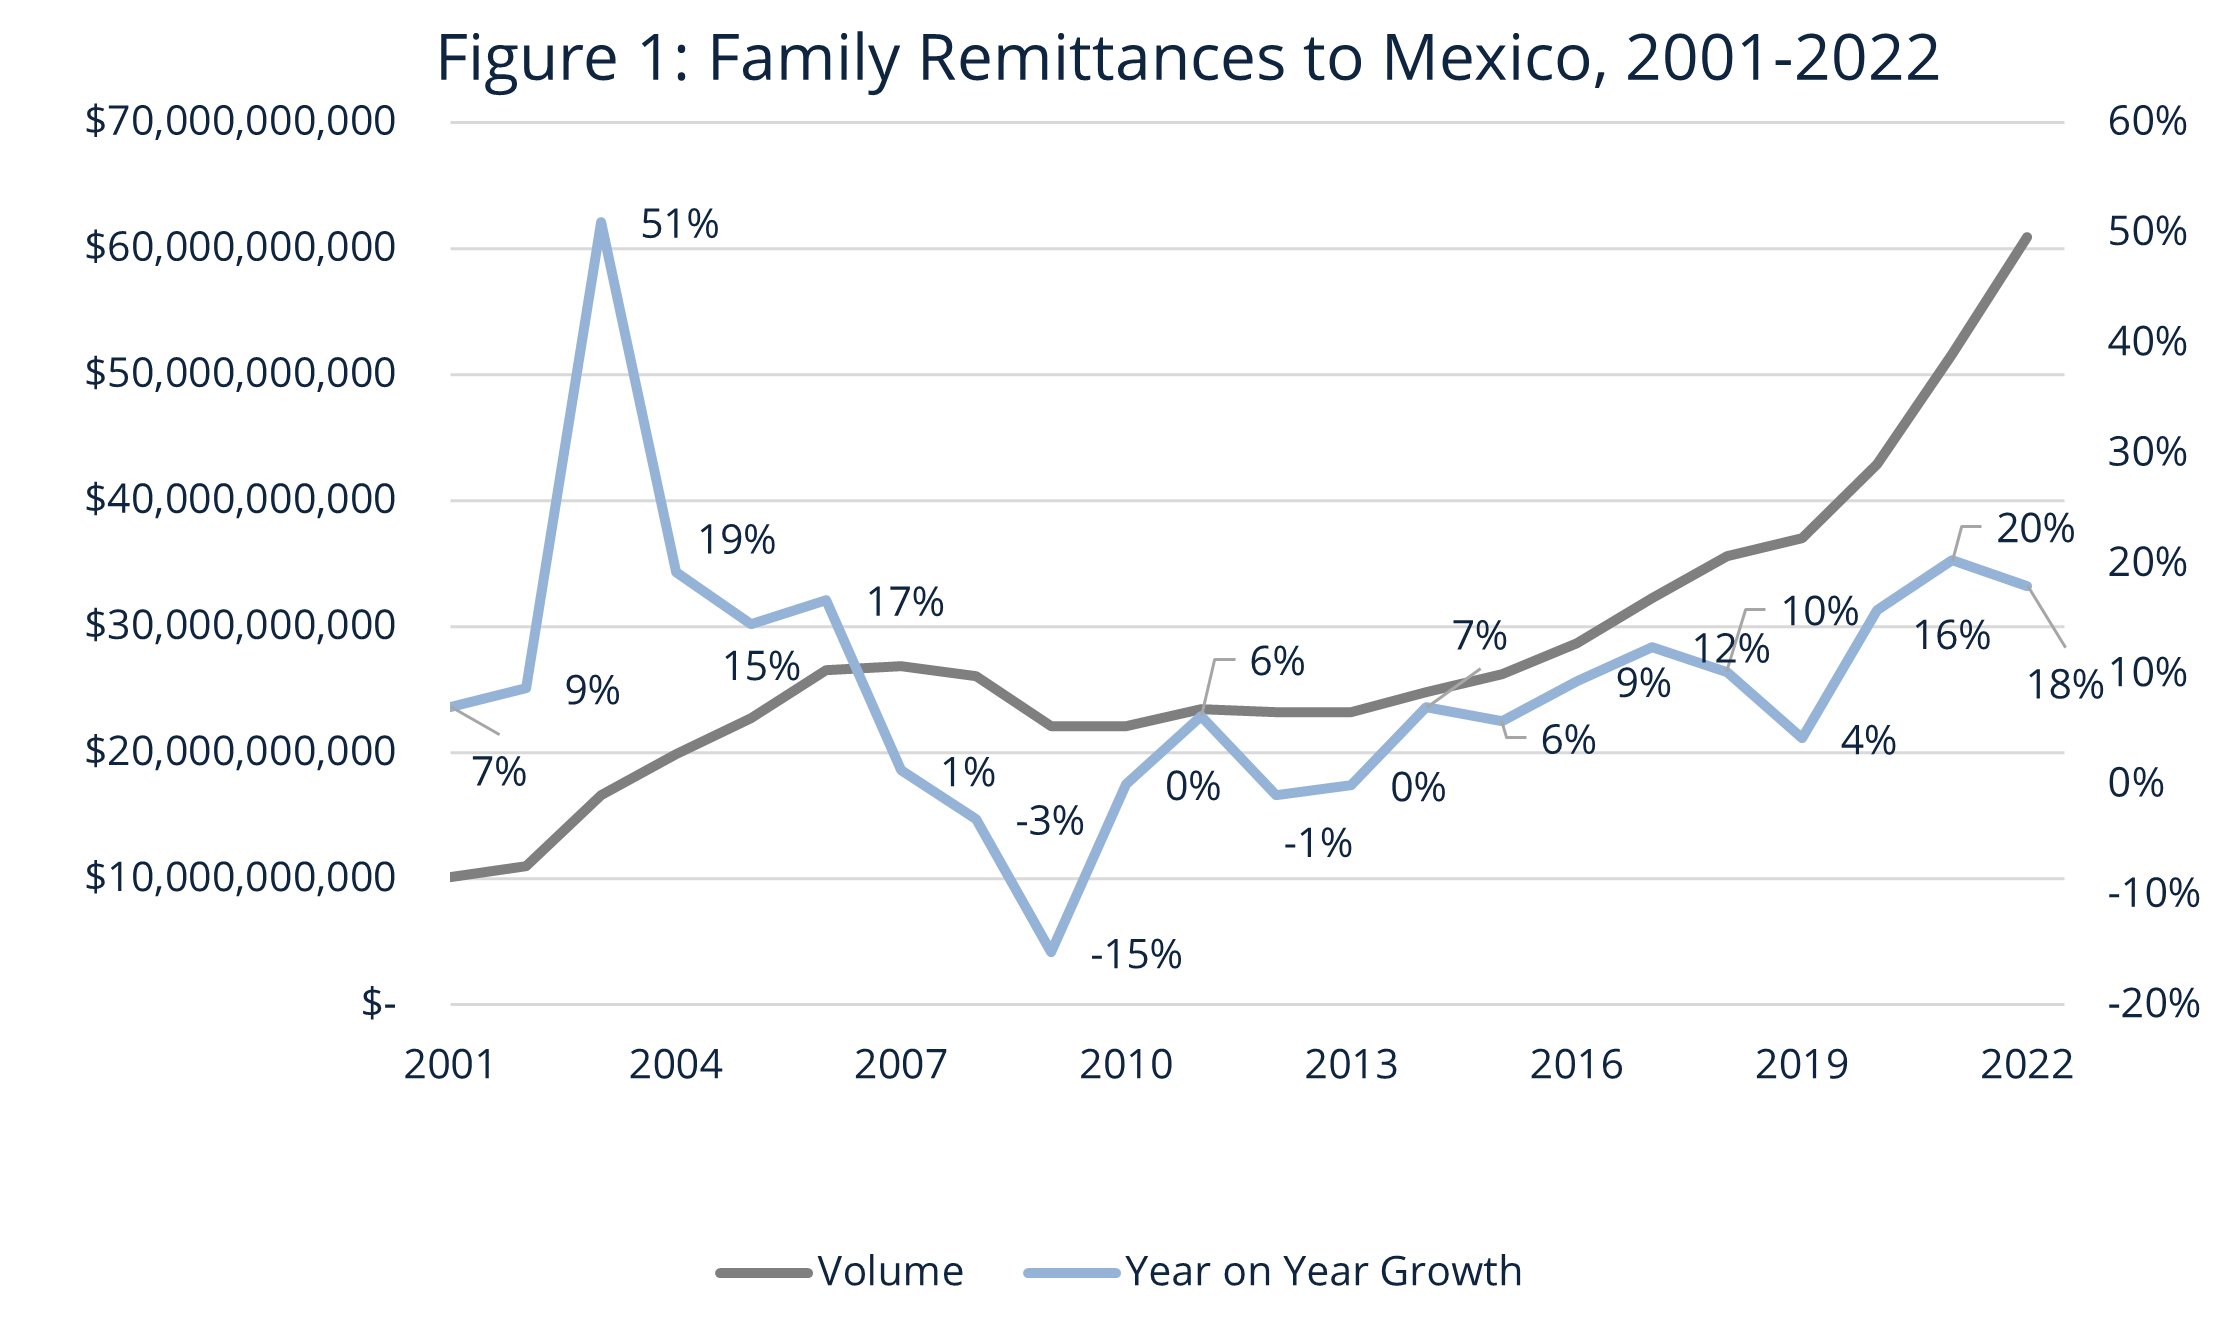
One important development within Latin America and the Caribbean is an outflow of migrants coming from different parts of the region. This includes Mexico. The base of remitters has been increasing because of this growing migration. Between 2010 and 2015, the total number of migrants from Mexico living in the US had declined from 12.1 million to 11.6 million and to 11.5 million in 2019. Since that point on, migration surpassed its 2010 numbers to 12,669,713 in 2022 – a cumulated increase of 7.42 percent.
Much of this migration may be attributed to irregular migration as identified in border apprehensions at the US-Mexico border (1), which more than doubled from 2020 to 2022 alongside legal migration (See Figure 2).
Further expanding to the base of Mexican remitters in the US is an increased immigration retention rate. In 2010, the average length of stay of an immigrant from Mexico in the US was 12 years, since 2020 this average has jumped to 20 years. Increasingly, Mexican migrants are staying longer in the US and, consequently, indirectly widening the pool of remittance senders in the country. Each year since 2018, 2 percent of migrants in the US stayed at least a year longer than the usual length of stay. This increase of time in the US increased the lot of remittance senders by at least 20,000 annually.
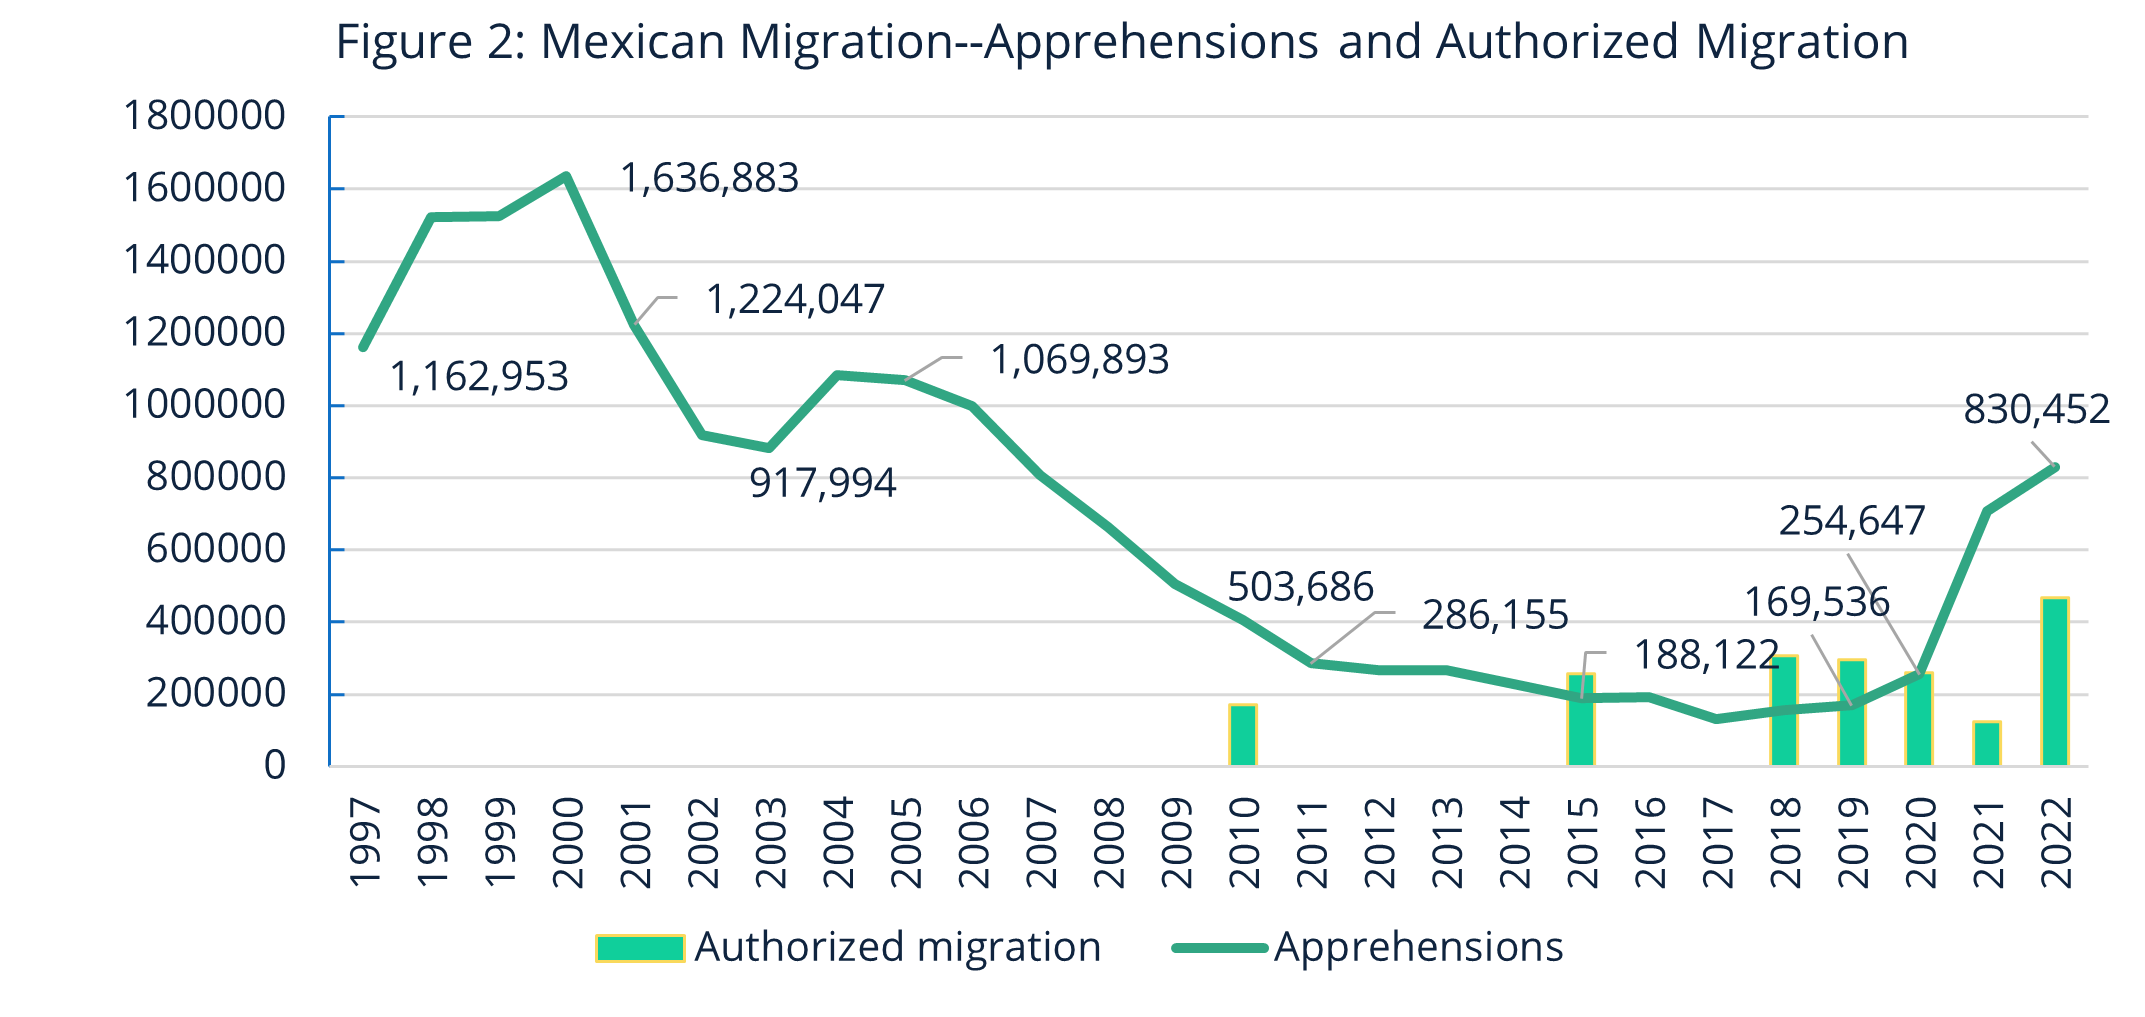
It is important to note that increases in migration, authorized and irregular, have played a key role in the number of senders. Migrant workers under the H2A and H2B visa program have doubled between 2018 and 2022 and quadrupled from 2010. In turn, the number of remittance senders has accumulated over time. These changes point to the increase of senders who remit to Mexico to more than nine million in 2023.
Table 1: Migration from Mexico to the United States
Remittance Sender Trends
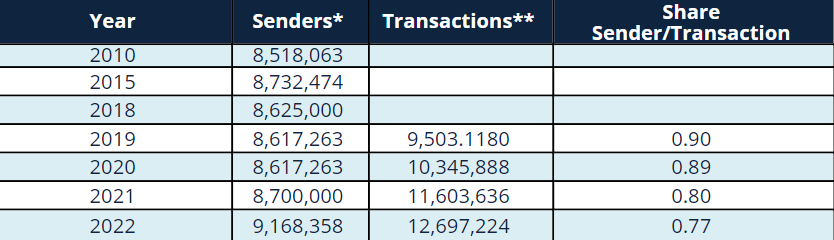
With regards to remitting patterns, apart from more senders (which increased 6.4 percent between 2020 and 2022), remitters are sending money back to Mexico more frequently and are doing so in greater numbers. The number of average annual transactions increased by 22.73 percent from 2020 to 2022, that’s three times more than the growth increases number of senders (2).
That is because the average sender sends money back home around 16 times a year up from 12 and 14 in prior decades (3). Apart from increased transactions, the number of senders increased 6.4 percent during the same period (See Table 2). As of 2022, there are 9,168,358 separate senders of remittances to Mexico from the US relative to 12.7 million transactions.
Table 2: Senders and Transactions of Money Transferred to Mexico
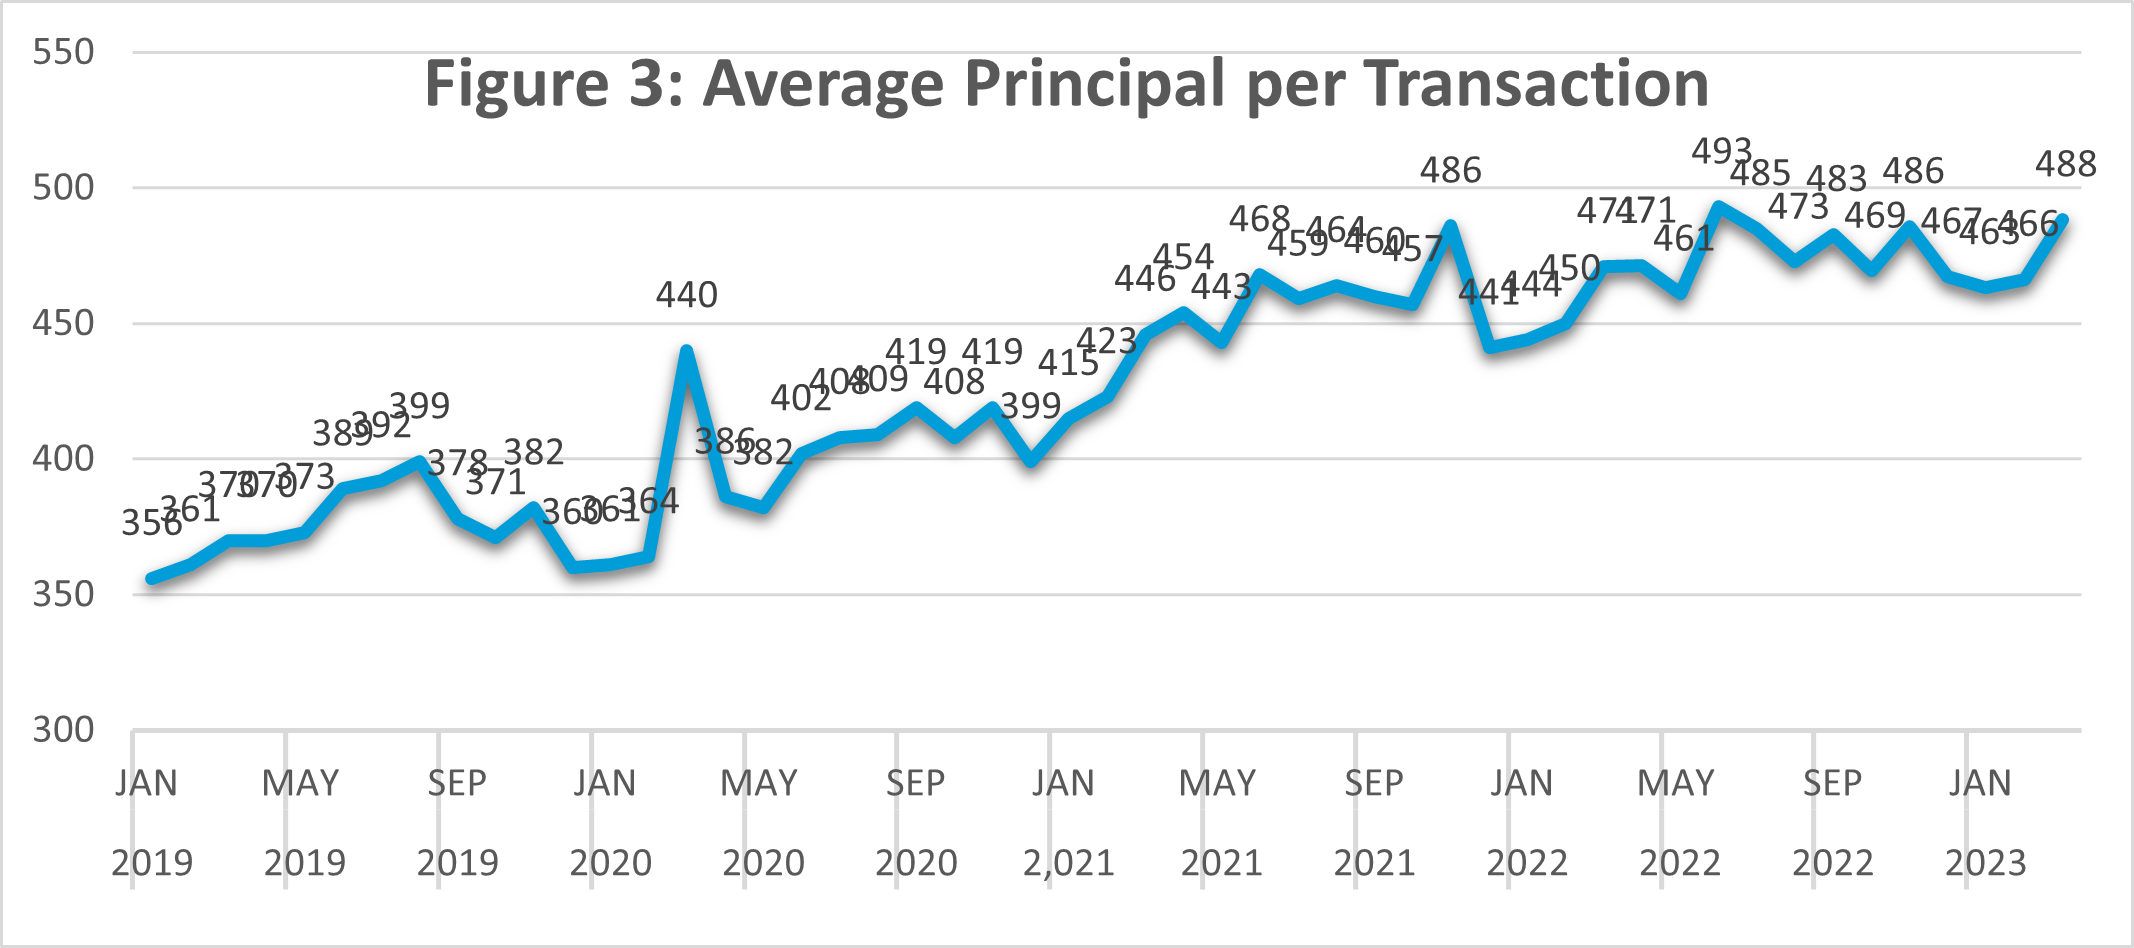
In addition to frequency increases, another aspect contributing to the growth of remittances is an increasing annual principal. Over the past three years, the principal sent has increased by 32.32 percent between 2019 and 2023 at an annual 5 percent increase. This means that Mexicans in the US are sending more each year total. As expected, the average principal per transaction has increased along with the annual rate (See Figure 3). The most recent average (as per remittance company data) for each transaction now stands at US$488.
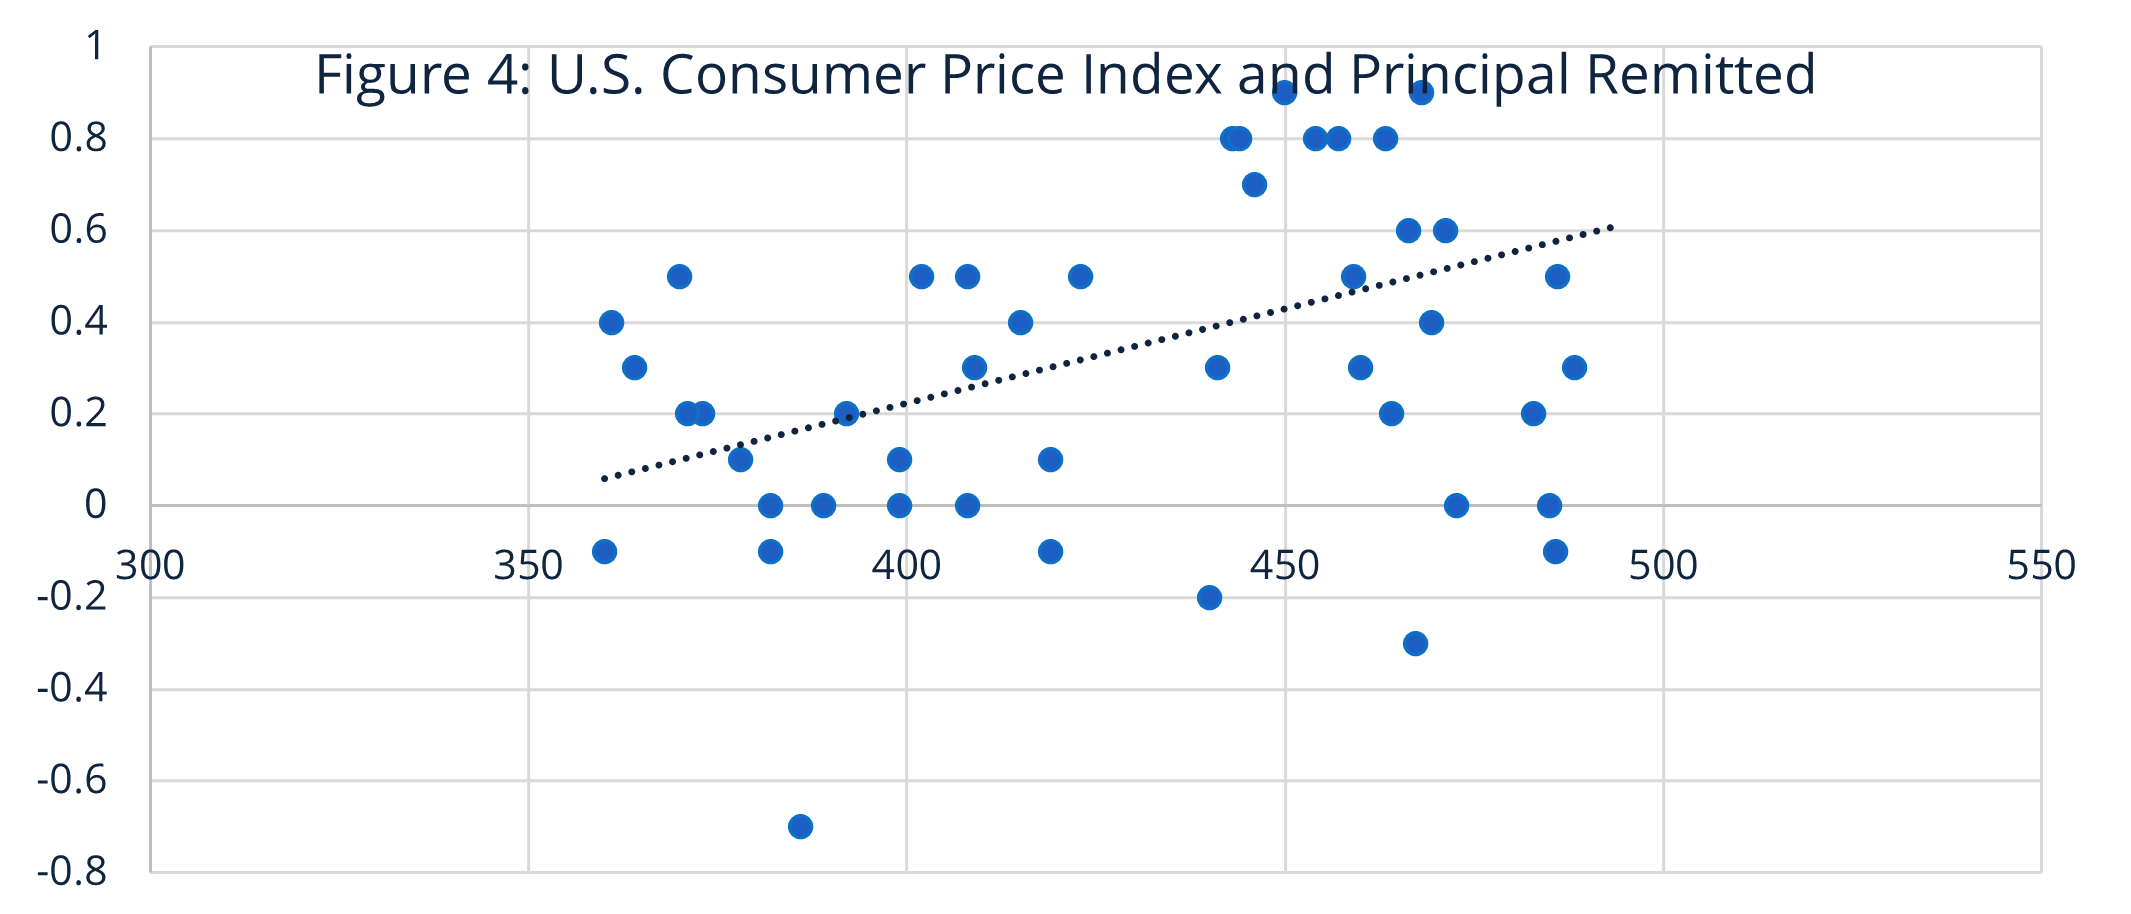
The increase in sending via the principal amount is important because it shows a higher percentage growth relative to migration. Its change is associated with inflationary trends in both the United States and Mexico since late 2020 (See Figure 4). Moreover, this pattern is important to be considered when looking at the slowing inflationary trend in 2023.
Three Caveats
These numbers do not consider three other factors. First, seasonal migration is a revolving door, therefore some of those migrants return to Mexico within two years, and assessing the annual net number of migrants that adds to the total Mexican migrant population is not calculated. Therefore, the numbers may be overestimating the number of senders.
Second, not all transactions are family to family transfers. Previous studies have pointed out that one tenth of all transactions are business to business or person to business transfers (4). Also, some of these transactions may originate in countries other than the United States.
Finally, this note does not cover differences in principal and frequency remitted by agent based (or offline) transactions and internet based (or online or digital) transactions. Survey data suggests that migrants send than 10 percent more when using digital transactions. However, market share data for digital transfers remains below 35 percent of all transactions, and therefore are not influencing the flows as much as overall increases in the principal and migration (5).
Future Growth in 2023?
Remittances to Mexico will continue to grow in 2023. However, growth rates may show a slower pattern than what has been observed since 2020. First, migration from Mexico may decline, at least relative to the number of irregular entries given current migration policy changes in the US government. However, the number of senders may be similar to 2022 because it will mostly originate from non-immigrant workers visas, adding to half million new senders.
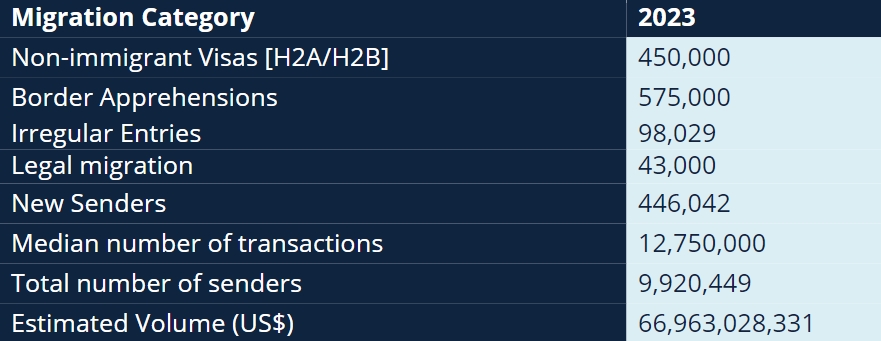
However, growth from the principal is likely to be lower due to a flatting in principal remitted since early 2023 staying at $475 per transaction sent. In turn growth of annual flows in 2023 may be between 8 and 10 percent.
1. U.S. CBP, 2023, https://www.cbp.gov/newsroom/stats/nationwide-encounters
2. Central Bank of Mexico.
3. Orozco, Manuel. Orozco, Manuel & Julia Yansura. 2017. On the Cusp of change. Migrant’s Use of the Internet for Remittance Transfer; Orozco, Manuel. 2021. A Commitment to Family: Remittances and the Covid-19 Pandemic.
4. Orozco, Manuel. Workers Remittances. Lynne Reiner. 2013.
5. Orozco, Manuel. Family Remittances Growth in 2021: Between Migration and Transaction Growth; 2022.
Table 1: * US Census Bureau, 2022; **US CBP, 2023 (https://www.cbp.gov/newsroom/stats/nationwide-encounters); *** a, We use DHS (2020) metrics on impactable border crossers and Title 8 releases. **** US Department of State, Immigrant visa statistics (tourist and work visas) (https://travel.state.gov/content/travel/en/legal/visa-law0/visa-statistics/nonimmigrant-visa-statistics.html), Impactable crossers: Impactable border crossers include adults without children who are not asylum seekers and (prior to 2017) who are not from Cuba. Aliens in this group are described as impactable because they are generally subject to the full range of DHS and Department of Justice (DOJ) enforcement consequences, and therefore potentially impacted by existing border enforcement. Non-impactable border crossers include unaccompanied alien children, family units, individuals who request asylum, and (prior to 2017) Cubans. To irregular entry, we include DHS 18% of all apprehended as irregular border crossers (https://www.dhs.gov/sites/default/files/publications/immigration-statistics/BSMR/ndaa_border_security_metrics_report_fy_2019_0.pdf.pdf). a calculates irregular migration (including 1.67 percent of tourist visa overstayers), temporary non-immigrant migrants and legal admissions.
Table 2: *Mexican senders are 75 percent of all migrants (or 80 percent of adults, according to surveys); **Central Bank of Mexico.
Table 3: Projections based on migration 2022 and DHS data as of April 2023.
Figure 3: Source: Remittance Service Provider data.
Figure 4: Ibid and US Department of Labor.
Why Do Remittances to Mexico Continue Breaking Records?
Family Remittances in 2021: Is Double-Digit Growth the New Normal?
The Remittance Marketplace in 2019: The Growing Role of Digital Payments
With the rising cost of wages in China, manufacturers are increasingly considering Mexico an attractive location to ‘re-shore’ production.

South Korea’s entry into the TPP will promote stronger cooperation between South Korea and Latin America.

PREAL series reviews three exemplary programs in US that recruit, train, and retain highly qualified principals.