


Migrant Remittances & Development in the Global Economy
How do patterns of migration and remittances differ across regions? What kinds of frameworks support the contributions of remittances to local development?
THE HISTORIC PATTERN
Central American migration is shaped by a combination of dynamics, mostly associated with poorly performing economies within the context of globalization as well as the historical legacies of repression and civil war.
In fact, the region exhibits four different migration periods:
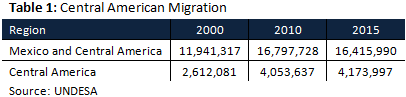
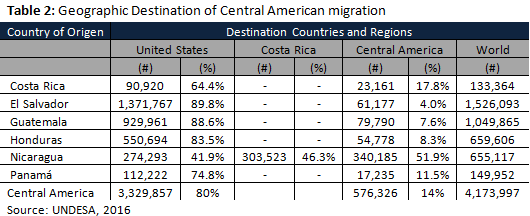
The table below (Table 1) shows how Central American migrants practically doubled from 2.6 million to 4.2 million within a span of fifteen years. Table 2 also shows that a large volume of migration is intra-regional, predominantly among Nicaraguans going to Costa Rica for work.
Recently, policy makers have distinguished two regions within Central America, the so-called Northern Triangle and the Southern region (Nicaragua, Costa Rica, and Panama). The Northern Triangle is considered a region exceedingly affected by the ravages of violence associated with dense waves of transnational organized crime, particularly narco-trafficking. The second region is mostly defined by intra-regional migration networks with Costa Rica and Panama as labor importing countries for Nicaraguans working in domestic labor, security, transportation, and construction activities (Panama in particular for construction).
The migration trend in the Northern Triangle has been spurred by waves of severe violence and insecurity associated with an environment of organized crime networks. In turn, a larger number of people have sought to leave their home countries, including many applying for political asylum to escape persecution from narco-trafficking networks, gangs, or extortion rings.
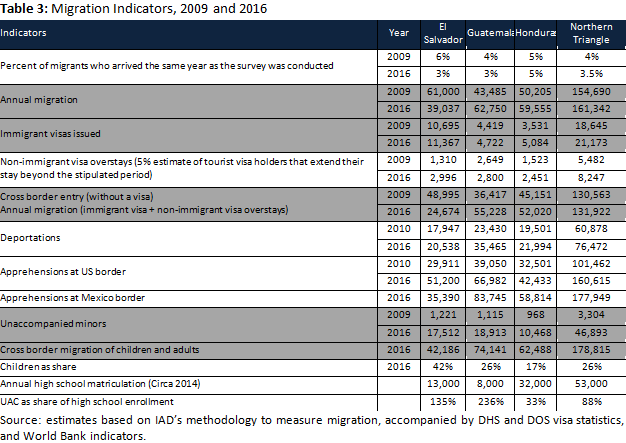
Table 3 below compares migration trends in 2009 and 2016. As of 2016, annual migration increased to over 160,000 people entering the US, the majority by crossing the US border. In addition, many unaccompanied minors have sought to come to the US in numbers that are comparatively as large as or larger than the annual enrollment rate in secondary school within their home countries.
The magnitude of this migration is measured by considering the number of people who are apprehended along the Mexico and U.S. border as well as by those who eventually enter. As part of the border-crossing dynamic, some migrants attempt to enter twice and others three or more times, reducing the number of actual emigrants to a smaller number when compared to the border crossing attempts. Total crossing attempts may be about 90% more than the numbers of those who actually entered. The problem is, however, that there are still large numbers of people who attempt to leave their countries but remain in transit trying to enter the US.[1] This means that the total migration outflows from this countries is higher than the one visible at the U.S.-Mexican border.
While the aforementioned patterns prevail, there are news reports that unauthorized cross border migration has declined since the number of people apprehended has declined. However, this picture is not entirely clear. Indeed, there has been a substantive decline in apprehensions but there has also been an increase of more than 15% of migration among and family units.
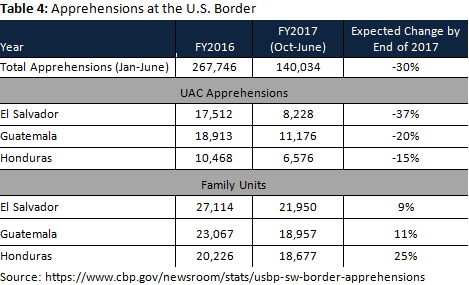
In regard to Guatemala, migration may have remained at the same levels. Data reveals that 14% of people in the Western Highlands of Guatemala had a relative migrate in 2017 and send money that same year. Moreover, the 9% growth in the remittance principal (amount sent per transaction, average) alone would not explain the aggregate value increase of 17% in remittances reported by the Central Bank. For El Salvador, the migration push continues, as more than 25% wanted to leave their country according to a 2014 survey. In 2016, the Universidad Centroamericana reported 40% wanting to leave.[2]
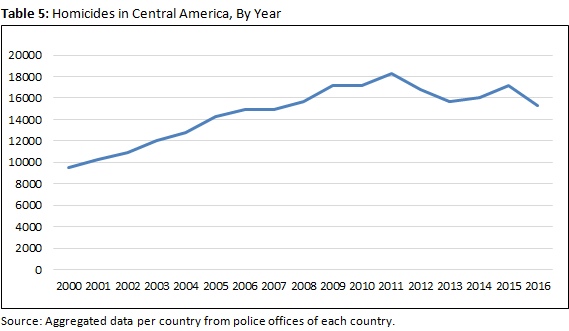
Declining homicides and violence in these countries may also be playing a role, as news outlets have reported that homicide rates in 2017 dropped at least 20% in the Northern Triangle and are expected to drop that much by the end of the year.
[1] https://www.uca.edu.sv/iudop/wp-content/uploads/Bolet%C3%ADn-Evaluaci%C3%B3n-A%C3%B1o-2016-10-01-2017.pdf
[2] Detained in Mexico: (10%*177,949/3)+(40%*177,949/x2)+(45%*177,949/1)+(5%*177,949/4) = 120,000; Apprehended in the US: (60%*160,615/1)+(35%*160,615/x2)+(5%*160,615/3) = 127,458. Total possible people who attempt to enter the US, 250,000, of which 130,000 make it.
How do patterns of migration and remittances differ across regions? What kinds of frameworks support the contributions of remittances to local development?
Despite the economic importance of migration, Central American governments have lacked integral policies to leverage migration for development.
More than 52,000 Central American children, passing through Mexico, have sought entry into the US.